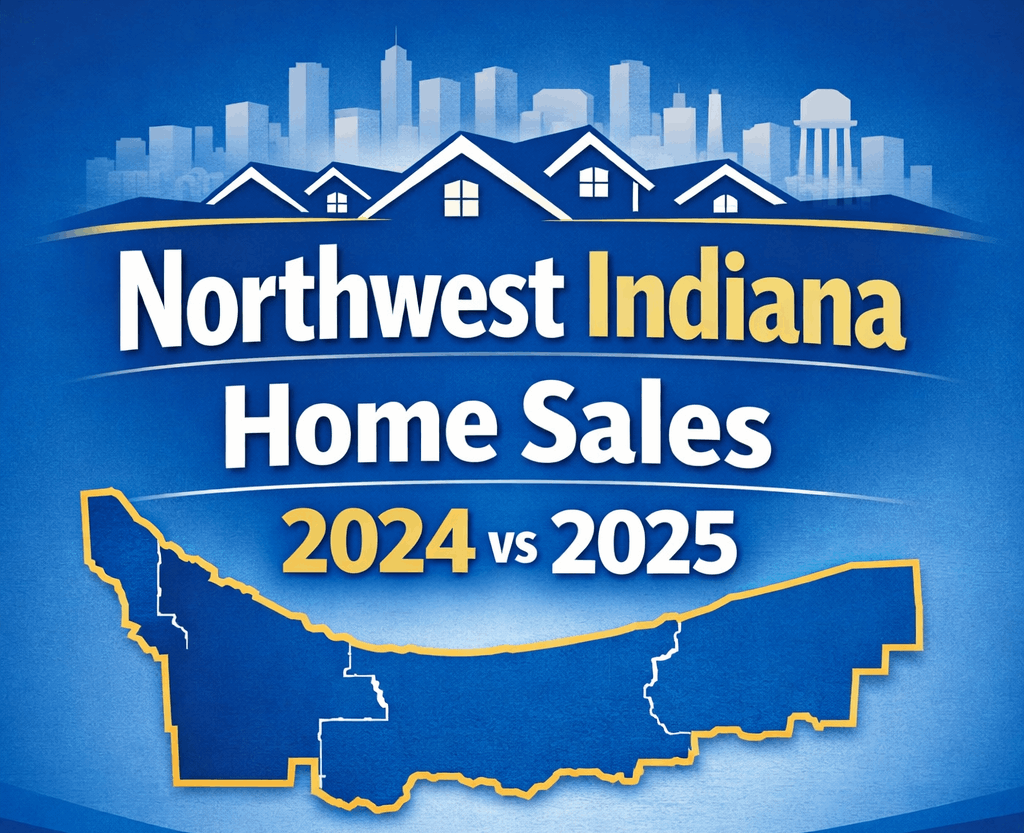
Northwest Indiana Residential Home Sales: 2024 vs 2025 Market Breakdown
Northwest Indiana Residential Home Sales: 2024 vs 2025 Market Breakdown
Higher rates made headlines, but the local data stayed steady. Here is what closed sales, prices, and speed tell us about Northwest Indiana, and how to use it if you are buying or selling.
Author: Realest Realty
Area: Lake County, Porter County, and surrounding Northwest Indiana communities
Data reference: Closed residential sales data reported through the Northwest Indiana Regional MLS
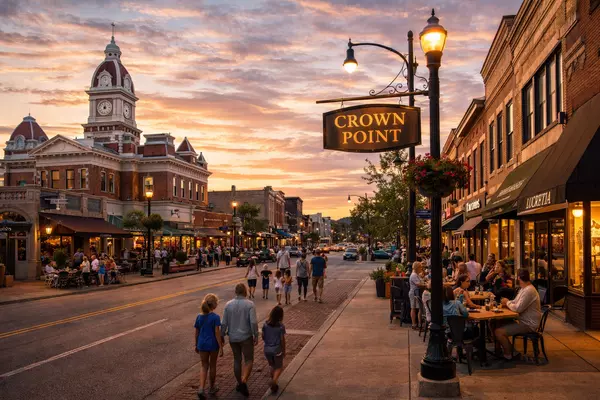
Related Realest resources: Realest Blog, Crown Point, Cedar Lake, St. John, Schererville, Merrillville, Munster, Lowell, Valparaiso, Dyer
The Big Picture in One Minute
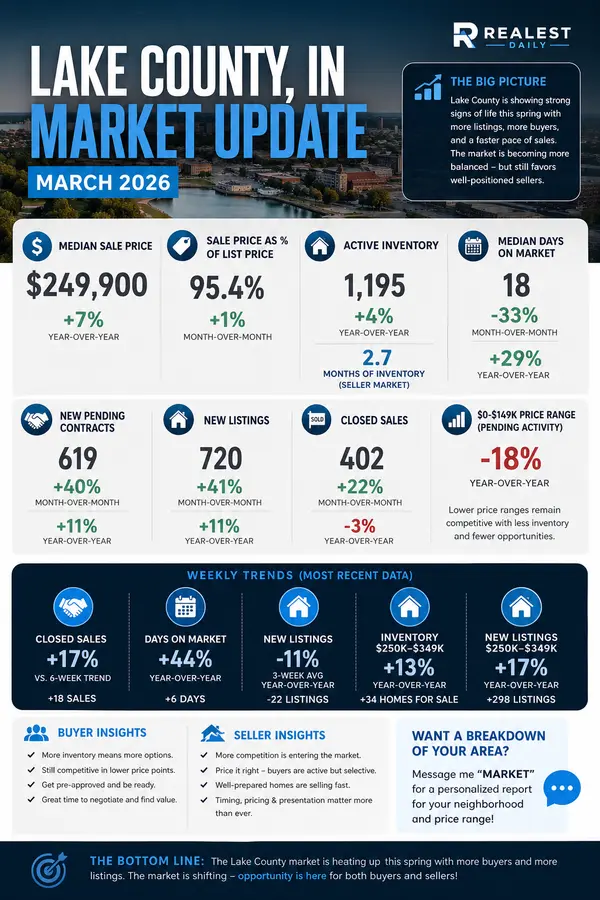
If you read only one section, read this. Northwest Indiana moved from 2024 into 2025 with steady demand, rising values, and a market that stayed competitive for homes that were priced correctly. The story is not “boom” and it is not “bust.” It is a market that learned to live with interest rates, and it is a market where strategy matters more than hope.
The data points in this report tell a consistent message. More homes sold, the median sold price increased, sold-to-list ratios stayed tight, and days on market rose only slightly. That combination usually indicates a stable local economy and buyer confidence, with a little more breathing room than the most intense years. For sellers, that is good news, but pricing and presentation matter. For buyers, opportunity exists, but preparation matters even more.
Total Home Sales: Market Activity Increased
One of the most direct signs of market health is the number of closed residential sales. In 2024, Northwest Indiana recorded 10,144 closed residential sales. In 2025, that number increased to 10,688 closed sales. That is an increase of more than 500 additional homes sold year over year.
Why does that matter. Because it happened in a period when many buyers were cautious. Interest rates were higher than what buyers got used to earlier in the decade. Affordability became a bigger part of the monthly payment conversation. Yet buyers still showed up, and transactions still closed.
In practical terms, this kind of sales increase often comes from a few overlapping forces. First, life still happens. People get married, expand their family, relocate, change jobs, and downsize. Second, markets with relative value tend to hold demand better. Compared to many higher-priced metros, Northwest Indiana remains attractive for buyers looking for more home for the money, plus commutability, plus lifestyle benefits. Third, when sellers price properly and present well, they unlock demand that might otherwise sit on the sidelines. Buyers may hesitate when they feel a home is overpriced, but they move quickly when a home feels like a fair deal.
If you are selling, this is the key takeaway. Demand did not disappear. It shifted toward homes that are positioned correctly. That is why it is not enough to list. You need to list with a plan.
Home Prices: Values Continued to Rise
The data shows that values in Northwest Indiana continued to rise in 2025. That matters because many people still assume that high rates automatically mean declining prices. Rates can cool demand, but prices are driven by supply, local employment, and the willingness of buyers to compete for quality inventory. In 2025, buyers still competed for well-priced homes.
Median Sold Price
- 2024: $269,000
- 2025: $278,000
That is a $9,000 increase in the median sold price. Median matters because it reduces the noise of a few extreme sales. A rising median typically means appreciation is broad-based, not limited to only the luxury segment.
Average Sold Price Per Square Foot
- 2024: $153
- 2025: $162
The price per square foot increased by about 6 percent year over year. When price per square foot rises, it often indicates that buyers are paying more for similar space, which supports the idea that the market strengthened rather than softened. It also suggests that appreciation was not isolated to one price bracket.
For homeowners, this reinforces an important point. Equity growth is not just something you see in national charts. It shows up locally, in real closed deals, when demand remains stable and inventory stays tight. That does not mean every neighborhood rose identically. It does mean that the overall trend remained positive.
For buyers, rising prices are a reminder that waiting for a perfect headline can be expensive. If you are financially ready, buying based on your plan often beats buying based on a prediction. And if you are not ready, it is a good time to get ready, because markets like this tend to reward buyers who are organized, pre-approved, and decisive.
Sold-to-List Price Ratios: Strong Seller Position
One of the most useful reality checks in any market is the sold-to-list ratio. It answers a simple question. When homes sell, are they selling close to asking price, or are they selling after large discounts.
In Northwest Indiana, the median sold-to-list ratio stayed remarkably consistent.
- 2024: 99.22 percent
- 2025: 99.24 percent
That consistency suggests that sellers maintained leverage when the home was priced correctly. It also suggests that buyers continued to compete, at least for the homes that felt like a fair value. In markets where sellers are struggling, this ratio usually falls more noticeably, and you see larger gaps between list and sale price.
It also points to a trend Realest sees constantly in real-world negotiations. Buyers will pay for clarity. When a home is well-prepared, marketed correctly, and priced to meet the market, buyers tend to write stronger offers. When a home feels like it is listed based on hope, buyers tend to step back, wait longer, and negotiate harder.
This is why pricing is not a one-time decision. It is part of the marketing strategy. The goal is not to “test the market.” The goal is to meet the market and create urgency.
Days on Market: Slightly Slower, Still Competitive
Days on market is where many people feel the shift before they see it in prices. In 2024, the median days on market was 17 days. In 2025, it moved to 19 days. That is a modest change, but it is worth understanding.
A two-day increase does not signal a weak market. It signals a market that is normalizing. Buyers have slightly more time to review the home, confirm the numbers, and make a decision. That can be a healthy shift, because it reduces the emotional frenzy that can lead to buyer regret. It also means sellers need to be more deliberate.
The other important point is that speed is not evenly distributed. In a balanced market, the best homes sell fast and the rest sit. That is why some homeowners feel like “nothing is selling,” while others see their neighbor sell in a weekend. The difference is usually pricing, condition, and location.
If you are a seller, the lesson is simple. You can still sell quickly, but you have to earn it. A clean, well-staged, well-photographed home with a smart pricing plan is still very likely to attract offers. A home that feels dated, cluttered, or overpriced will often take longer, and longer market time can create negotiation leverage for buyers.
Total Sales Volume: More Dollars Moving Through the Market
Total sales volume tells you how much money moved through residential real estate across the region. It combines the number of closed sales with the prices that buyers paid. In 2024, total sold volume was about $3.04 billion. In 2025, it increased to about $3.32 billion. That is roughly $300 million more in closed residential real estate volume year over year.
This matters because volume is often a confidence indicator. When volume rises, it usually means buyers are still committing, lenders are still lending, and sellers are still willing to list. It also impacts local economies. Real estate volume supports local contractors, inspectors, lenders, attorneys, moving companies, and small businesses that serve homeowners.
A market can have rising prices but falling volume, which can indicate fragility. In this case, volume increased along with prices, which is a stronger signal. It suggests the Northwest Indiana market remained active, not just expensive.
What This Means for Sellers
If you are considering selling in 2025 or early 2026, the market data supports a confident approach, but it also demands a strategy. Values increased year over year. Homes still sold close to list price. Median days on market stayed low. Those are strong conditions.
Seller advantages that still exist
- Higher values than last year: Appreciation gives you more flexibility when planning your next move.
- Serious buyers are still in the market: Many buyers adjusted expectations and are making decisions based on monthly payment, not rate headlines.
- Well-priced homes still move quickly: Speed is available when the home is positioned correctly.
- Sold-to-list ratios stayed strong: Discounts are not the default when the home is priced right.
Seller risks that are more common now
- Overpricing creates buyer skepticism: Buyers are payment-sensitive and quick to skip homes that feel inflated.
- Condition matters more: When rates are higher, buyers are less excited about taking on repairs.
- Stale listings lose leverage: Longer market time often leads to stronger buyer negotiation, even in a stable market.
A Realest-style listing plan focuses on three things. First, price the home based on current neighborhood-level closed sales, not wishful thinking. Second, prepare the home so it photographs and shows like the best version of itself. Third, launch with marketing that creates urgency early, because the first two weeks are often the most powerful window for competing offers.
What This Means for Buyers
Buyers are not powerless in this market. The data shows stability, not runaway acceleration. Days on market increased slightly. That can create opportunities, especially on homes that are overpriced or need work. But buyers still need to be prepared, because the best homes still attract attention quickly.
Buyer opportunities in a steadier market
- More time than the frenzy years: A small increase in days on market often means less pressure to decide in hours.
- Negotiation is more situational: Homes that sit longer may offer better terms, credits, or price adjustments.
- Offer structure matters: In higher-rate environments, smart financing strategy can matter as much as price.
- Local knowledge is a competitive edge: Understanding micro-markets can help you spot value.
Buyer pitfalls to avoid
- Waiting for a perfect headline: Timing the market often backfires, especially when values are rising.
- Falling in love before doing the math: Monthly payment comfort should lead the decision, not emotions.
- Assuming every listing is negotiable: Well-priced homes in strong areas can still go fast.
A practical buyer plan looks like this. Get fully pre-approved, not just pre-qualified. Identify neighborhoods that match your lifestyle and commute. Watch real closed sales, not just list prices. And when the right home appears, move with confidence. If you want to browse by area, Realest has neighborhood pages that make it easier to focus your search. Start with Crown Point or Valparaiso, then compare nearby options like Cedar Lake and St. John.
Neighborhood-Level Reality: Why It Still Feels Different Street to Street
Market averages are useful, but they are not the whole story. Northwest Indiana is not one neighborhood. It is a collection of micro-markets, each with different buyer pools, price points, school preferences, commute patterns, and housing styles.
That is why you can see two homes with similar square footage perform very differently. One may sell quickly near list price, while another sits. Often the reason is not “the market.” It is neighborhood demand, lot, layout, updates, and how the home was priced compared to recent closed sales.
Here is a simple way to think about it. Buyers shop in categories. They shop by school district, commute time, and lifestyle. If your home matches what they want, and it is priced correctly, you can still get strong results. If your home does not match what that buyer category wants, the home needs to be priced in a way that creates a clear value story.
Realest encourages homeowners and buyers to use neighborhood pages as the starting point for research. If you are moving within the region, compare communities like Schererville, Munster, and Dyer. If you want more space and a different pace, explore places like Lowell. If you want a college-town feel and access to regional amenities, Valparaiso is often a strong option.
2026 Strategy Guide: How to Use This Data Right Now
Market reports are only useful when they change the way you act. Here is how to turn these numbers into decisions.
If you are selling in early 2026
Start with a neighborhood-level pricing review. The sold-to-list ratio staying near 99 percent tells us buyers are paying close to asking price when pricing is accurate. The days-on-market shift tells us buyers are less forgiving when pricing is optimistic. So your best move is to price for attention, not for ego.
Next, prepare the home for the first impression. In a stable market, buyers compare listings carefully. A clean home, neutral presentation, and strong photos are not “nice to have.” They are often the difference between a showing and a scroll past. The goal is not perfection, it is clarity. Buyers should understand the value within seconds.
Finally, plan for smart negotiation. Many sellers can still net strong results, but buyers are more payment-conscious. Sometimes a small credit or a rate buydown strategy can outperform a price cut. A good agent will help you compare options based on your net proceeds, not just your headline number.
If you are buying in early 2026
Do not make rate headlines your decision-maker. Make your monthly payment, your savings plan, and your timeline the decision-maker. Then use the market behavior to your advantage. A slightly longer median days on market can help you avoid panic. But remember, the best homes still sell quickly, especially in high-demand pockets.
A strong buyer strategy includes: pre-approval, clear neighborhood targets, quick scheduling for showings, and an offer plan that fits your comfort. If you want to start browsing and tracking what is happening, use Realest neighborhood pages and the Realest Blog as your hub: https://www.realest.com/blog.
Local Resources That Help Deals Close Smoothly
Real estate is not just buyers and sellers. A smooth closing often depends on the quality of the local professionals involved. Here are a few Northwest Indiana and Indiana-based resources that many homeowners recognize. This is not a requirement list, just a helpful starting point for people researching the process.
- Local banking and lending options: Centier Bank and Horizon Bank are well-known Indiana and region-serving banking brands, with mortgage and banking resources available online.
- Mortgage education and resources: Ruoff Mortgage provides a large library of guides, FAQs, and homeowner resources that buyers often find helpful while learning the process.
- Inspection planning: If you live in Crown Point and want to understand local inspection categories and city guidance, the City of Crown Point posts inspection information online: Crown Point Inspections. For private home inspection services, examples of local providers include Magnified Residential Inspections and Pillar To Post, The Tim James Team.
If you want a Realest-style approach, we can help you build a simple closing plan based on your timeline, including inspection timing, negotiation priorities, and what to watch for in the paperwork so you feel confident at every step.
FAQ: Northwest Indiana Market Questions
Is the Northwest Indiana market slowing down or stabilizing?
Based on the 2024 vs 2025 metrics in this report, it looks more like stabilization than a slowdown. Sales increased year over year, prices rose, and homes continued to sell close to list price. Days on market rose slightly, which is often a sign of normalization rather than weakness.
Do higher interest rates automatically mean home prices should fall?
Not automatically. Rates impact affordability and buyer behavior, but prices are also driven by supply, local job stability, and how many homes are available in the neighborhoods buyers prefer. In Northwest Indiana, 2025 still showed price growth.
What is the biggest mistake sellers make in a steadier market?
Overpricing. When buyers are payment-sensitive, they are quick to pass on listings that feel inflated. A strong pricing strategy is built on recent closed sales in your specific neighborhood, plus a realistic understanding of condition and competition.
What is the biggest mistake buyers make right now?
Shopping without preparation. The best homes still move quickly, even in a more balanced market. If you wait until after you find the home to get fully approved, you often lose leverage. A strong plan includes full pre-approval, clear neighborhood targets, and a quick showing schedule.
How can I get a price range for my home without guessing?
A neighborhood-specific value review should look at recent closed sales, current active competition, days on market, and which upgrades actually produce a return. Realest can run a data-driven analysis tailored to your address, your condition, and your timing goals.
Where can I browse homes by Northwest Indiana community?
You can start by exploring Realest neighborhood pages, such as Crown Point, Schererville, St. John, Valparaiso, and more on the Realest Blog.
Fun Facts and Fast Takeaways
- More sales closed in 2025: That points to steady real-life demand, not just online interest.
- Median price rose year over year: Appreciation continued even with higher rates.
- Sold-to-list stayed near 99 percent: Buyers still paid close to asking for correctly priced homes.
- Days on market rose only slightly: The market gave buyers a little more time, but not a lot.
- Volume increased by roughly $300 million: More money moved through residential real estate across the region.
- Micro-markets matter: The “market” is not one thing. Neighborhood, condition, and pricing drive outcomes.
Next Steps With Realest
Search Crown Point Homes
Explore active listings and neighborhood trends in Crown Point, Indiana.
View Local Listings Across Northwest Indiana
Compare communities and find the best fit for your lifestyle. Start with a few popular areas: Schererville, St. John, Merrillville, Munster, Valparaiso.
Find Your Home Value
Want a neighborhood-specific price range based on real closed sales and current competition. Request a data-driven home value analysis and pricing strategy.
What you get:
- Price range based on recent closed sales and current actives
- What buyers are paying for in your neighborhood right now
- Which improvements are most likely to increase your net proceeds
- A simple timeline plan for listing, showing, and closing
Let’s Talk Strategy
The numbers show where the market is headed. Your results come down to strategy, timing, and execution. If you want a plan tailored to your goals, Realest can help you map it out clearly.
Search Homes on Realest
Categories
- All Blogs (82)
- buyers (7)
- commercial (2)
- Community & Lifestyle (18)
- first time buyers (12)
- Home Buying Tips (11)
- Home Selling (4)
- homebuyers (12)
- Homeownership & Maintenance (4)
- Join Realest (5)
- Listings (16)
- Local Market Insights (18)
- real estate (12)
- real estate agent (11)
- Real Estate Investing (2)
- Real Estate News & Trends (5)
- sellers (6)
- selling (3)
Recent Posts